Green Scale
Can Climate Education Be as Engaging as a Game?
My role
UX Designer -
Product, UX/UI, Research
My team
Project manager, UX Lead, UX Designer, UI Designer
Duration
4 weeks
PROCESS
THE CONTEXT
Imagine this: Ever wondered how your everyday actions impact the planet but got lost in a sea of confusing numbers or overwhelming advice?
What if understanding and reducing your carbon footprint was as easy as answering a few questions?
What if there is a tool to empower students to take charge of their carbon impact visualize it in relatable terms, and offers personalized tips to reduce it—one small action at a time.
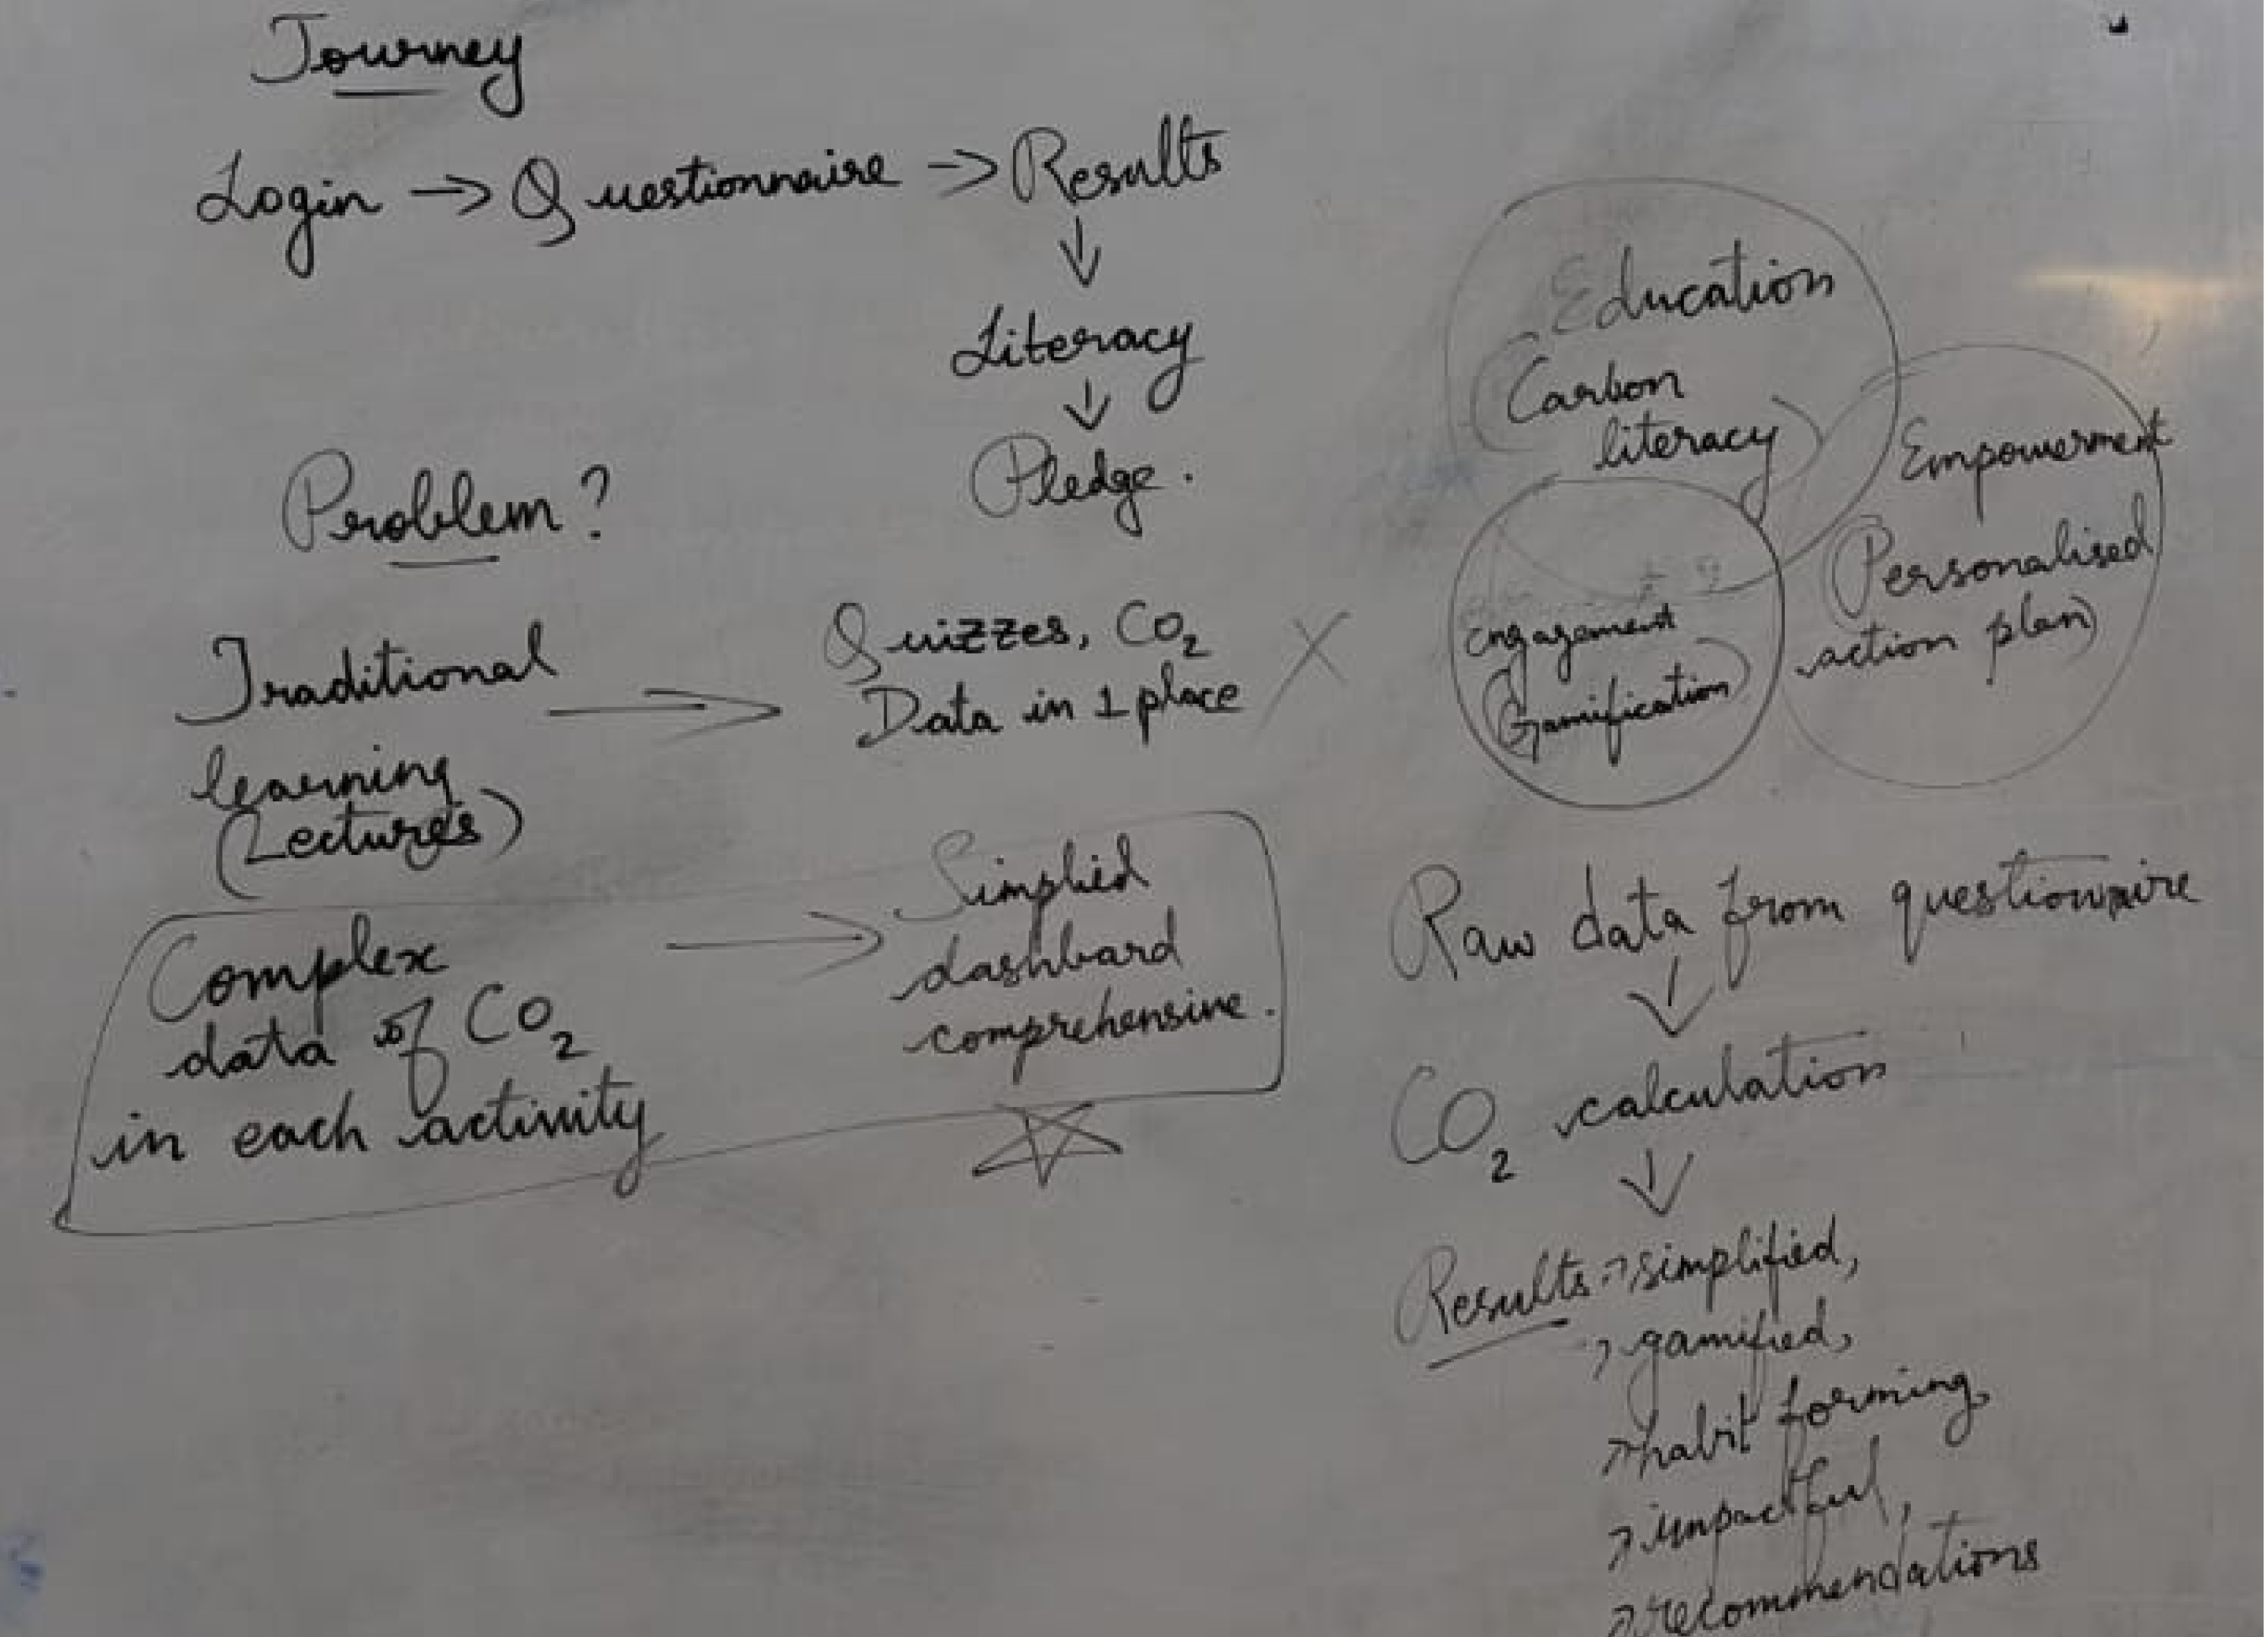
DISCOVERY WORKSHOP
In order to understand about the product or its goals, we've brainstormed these questions to ask stakeholders to better understand their institutional requirements and the product's purpose and design a user-friendly solution.
PROJECT BACKGROUND
Green Scale is a web application designed to bridge the gap in climate literacy for high school and university students. By leveraging gamification, interactive storytelling, and data visualization, the platform empowers young learners to understand and reduce their carbon footprint.
Bridging the knowledge gap between individual choices and carbon impact to make climate literacy engaging and actionable for students.
GOAL
To educate and empower students to understand and reduce their carbon footprint through an interactive web application.
LET'S TALK ABOUT THE PROBLEM
Despite increasing awareness about climate change, a knowledge gap persists in translating theoretical concepts into actionable habits.
Current solutions often fail due to:
* Lack of engaging content.
* Overemphasis on guilt-based messaging.
* Poor contextualization of carbon emissions.
USER PERSONAS

Li Hua
16 Years, Female
11th Grader at GIIS Singapore
INTERESTS
Tech-savvy, learning, entertainment
LEARNING PREFERENCES
Visual learner who responds well to infographics, videos, and gamified experiences. Prefers bite-sized
content and practical examples.
Description
Li is a High school student (Grade 11) interested in learning about climate change and reducing her carbon footprint. Li is tech-savvy, frequently uses her smartphone for entertainment and learning, and responds well to visual and gamified content.
Goals
Understand the personal impact of daily actions on climate change.
Learn practical steps to reduce carbon footprint.
Feel empowered to make a difference.
Share knowledge and influence others.
Pain points
Lack of clarity on how daily actions contribute to climate change
Limited access to practical, actionable steps to reduce her carbon footprint
Feels disempowered or overwhelmed by the scale of the climate crisis
Difficulty in influencing or sharing knowledge with peers effectively

Logan Levine
17 Years, Male
12th Grader at Branksome Hall Canada
INTERESTS
Gaming, social media, hanging out with friends
LEARNING PREFERENCES
Visual and interactive, but often disengaged with academic content
Description
Logan is a typical 17-year-old: social media-savvy, entertainment-focused, and not overly concerned with global issues. He's more interested in immediate gratification than long-term impacts.
Goals
Learn new concepts only if they’re directly relevant or interesting to him.
Only interested in learning if it has an immediate, visible benefit to his life.
Avoid activities or topics that feel abstract or unrelatable.
Stick to easy, entertaining content that doesn’t demand too much effort.
Pain points
Finds topics like climate change irrelevant and boring.
Loses interest quickly if content isn’t engaging or visually stimulating.
Lacks motivation to learn about issues that feel distant or complex.
Dislikes long-form content or heavy academic language that requires effort to understand.
RESEARCH INSIGHTS
Potential for integration with schools, environmental organizations, and social platforms to drive larger impact.
Using the polar bear as a mascot creates a strong emotional appeal, making climate change relatable and urgent.
Visual storytelling and scenario-based learning enhance retention and encourage behavioral change.
A modular design system allows for easy expansion into new sustainability topics.
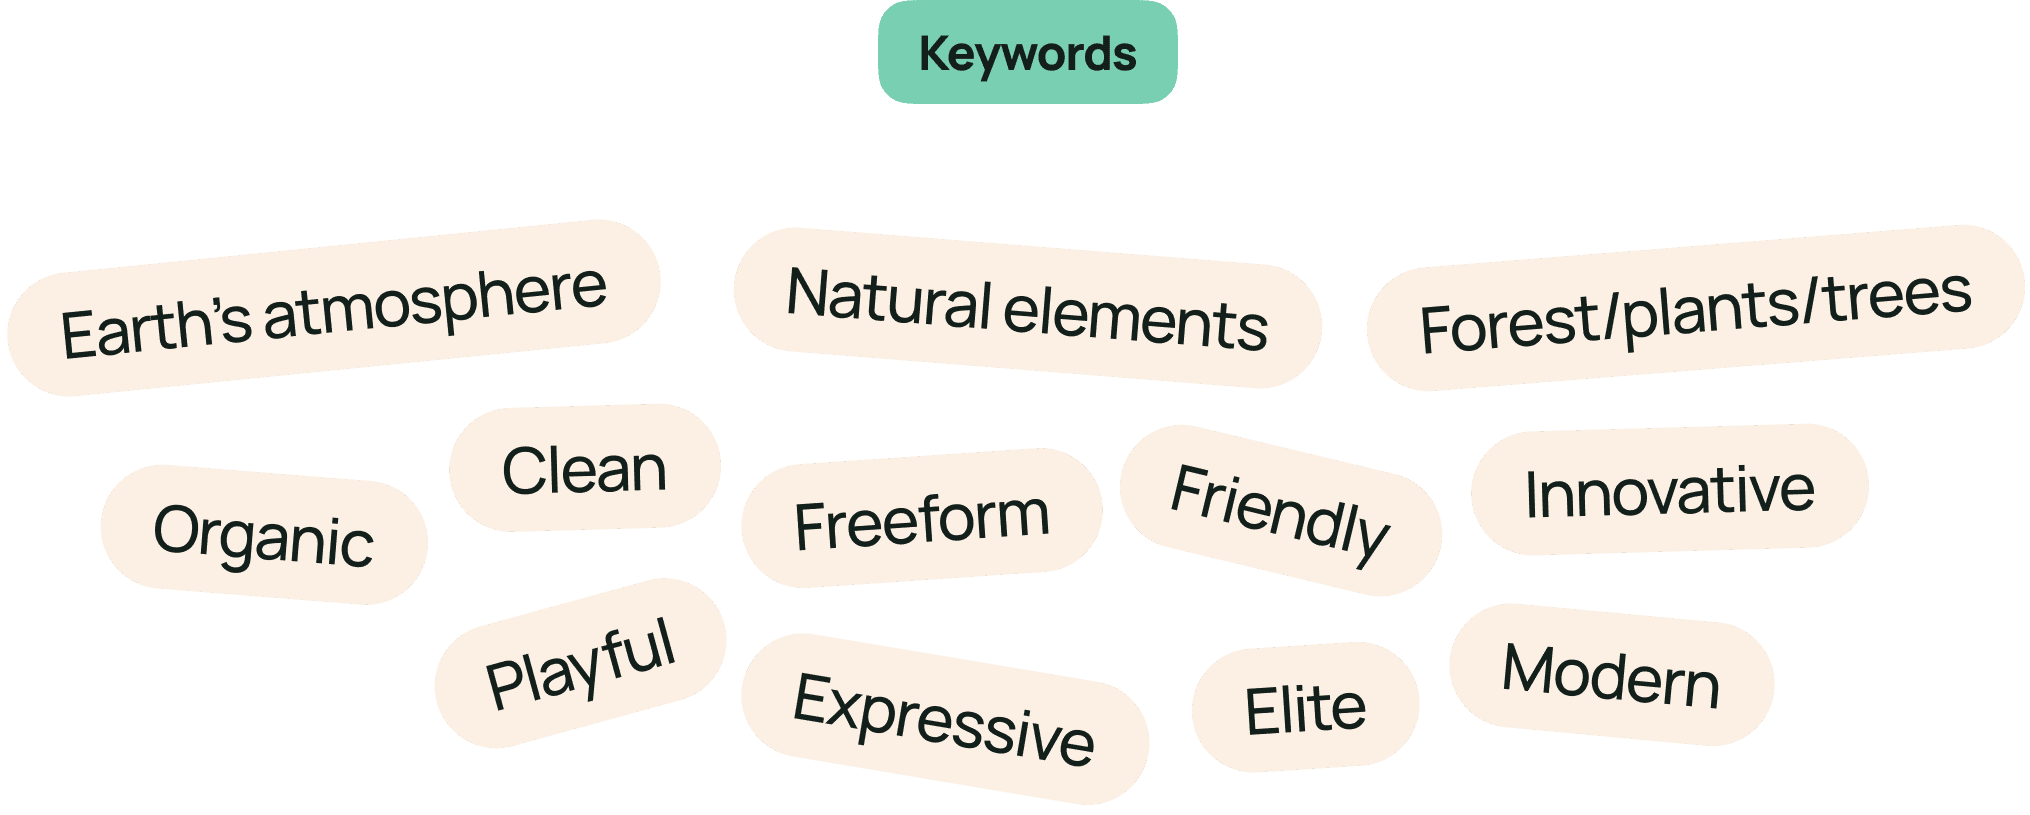
VISUAL MOODBOARD
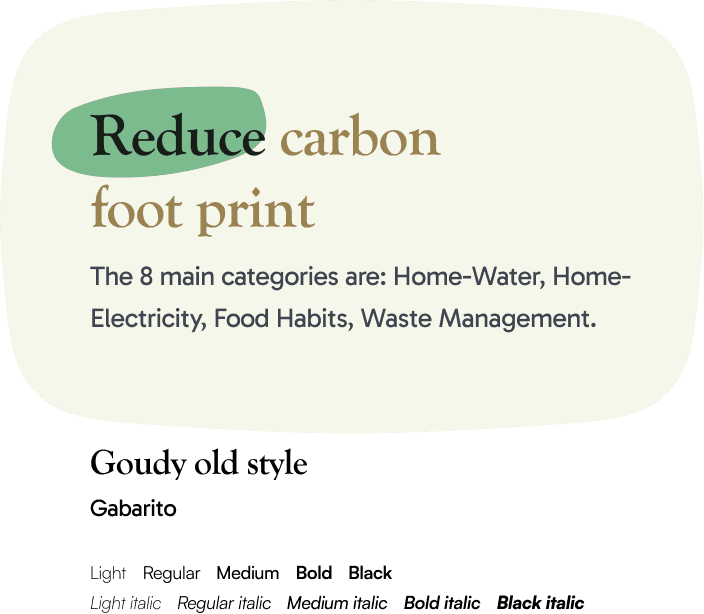
TYPOGRAPHY
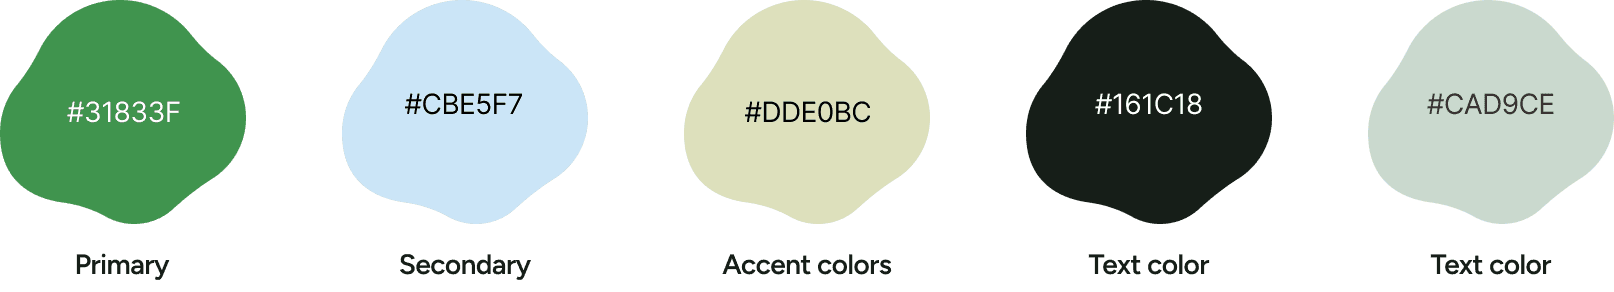
COLORS
Custom illustrations
Bringing Carbon Literacy to Life
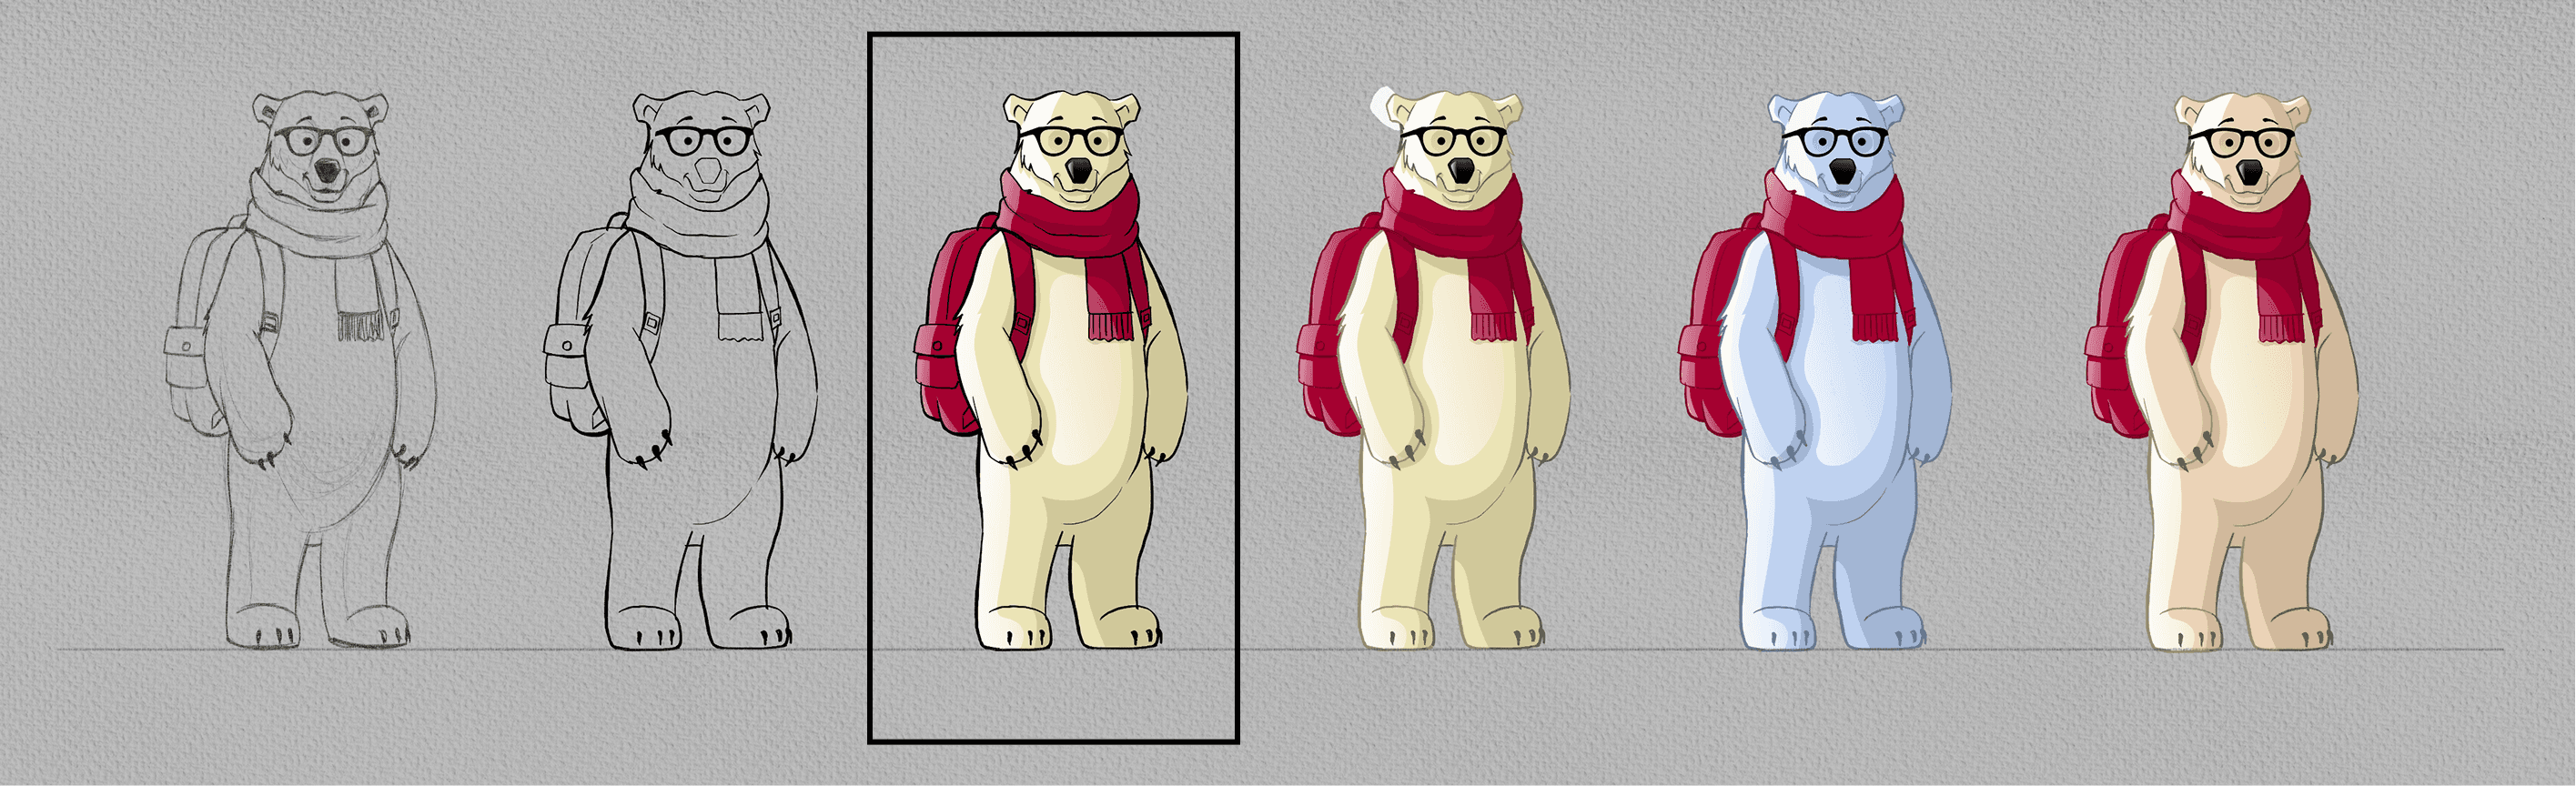
Character Design: The Educational Polar Bear Mascot
Our mascot design embodies the perfect balance between approachability and educational authority - a sophisticated polar bear wearing glasses and carrying a backpack. This character choice was deliberately made to:
Represent Climate Impact: As an Arctic species directly affected by climate change, the polar bear creates an immediate emotional connection to environmental issues
Educational Authority: The addition of glasses and scholarly accessories positions the character as a knowledgeable guide rather than just a cute mascot
Relatable to Students: The backpack and school accessories help students identify with the character as a fellow learner
Design Evolution: The character development progressed from basic pencil sketches to refined digital illustrations, maintaining consistent proportions and personality throughout
Character States and Animations
The polar bear mascot was designed to be highly versatile, appearing in different states that correspond to various user interactions:
Question Guide: The mascot dynamically demonstrates activities related to each survey question, making the assessment process more engaging
Celebration Moments: Instead of providing feedback, the mascot celebrates milestones—cheering when a set of questionnaire responses is completed. This approach ensures a positive reinforcement experience without influencing users’ answers.
Educational Moments: The character takes on a teaching role when explaining complex concepts, using props and gestures to illustrate points
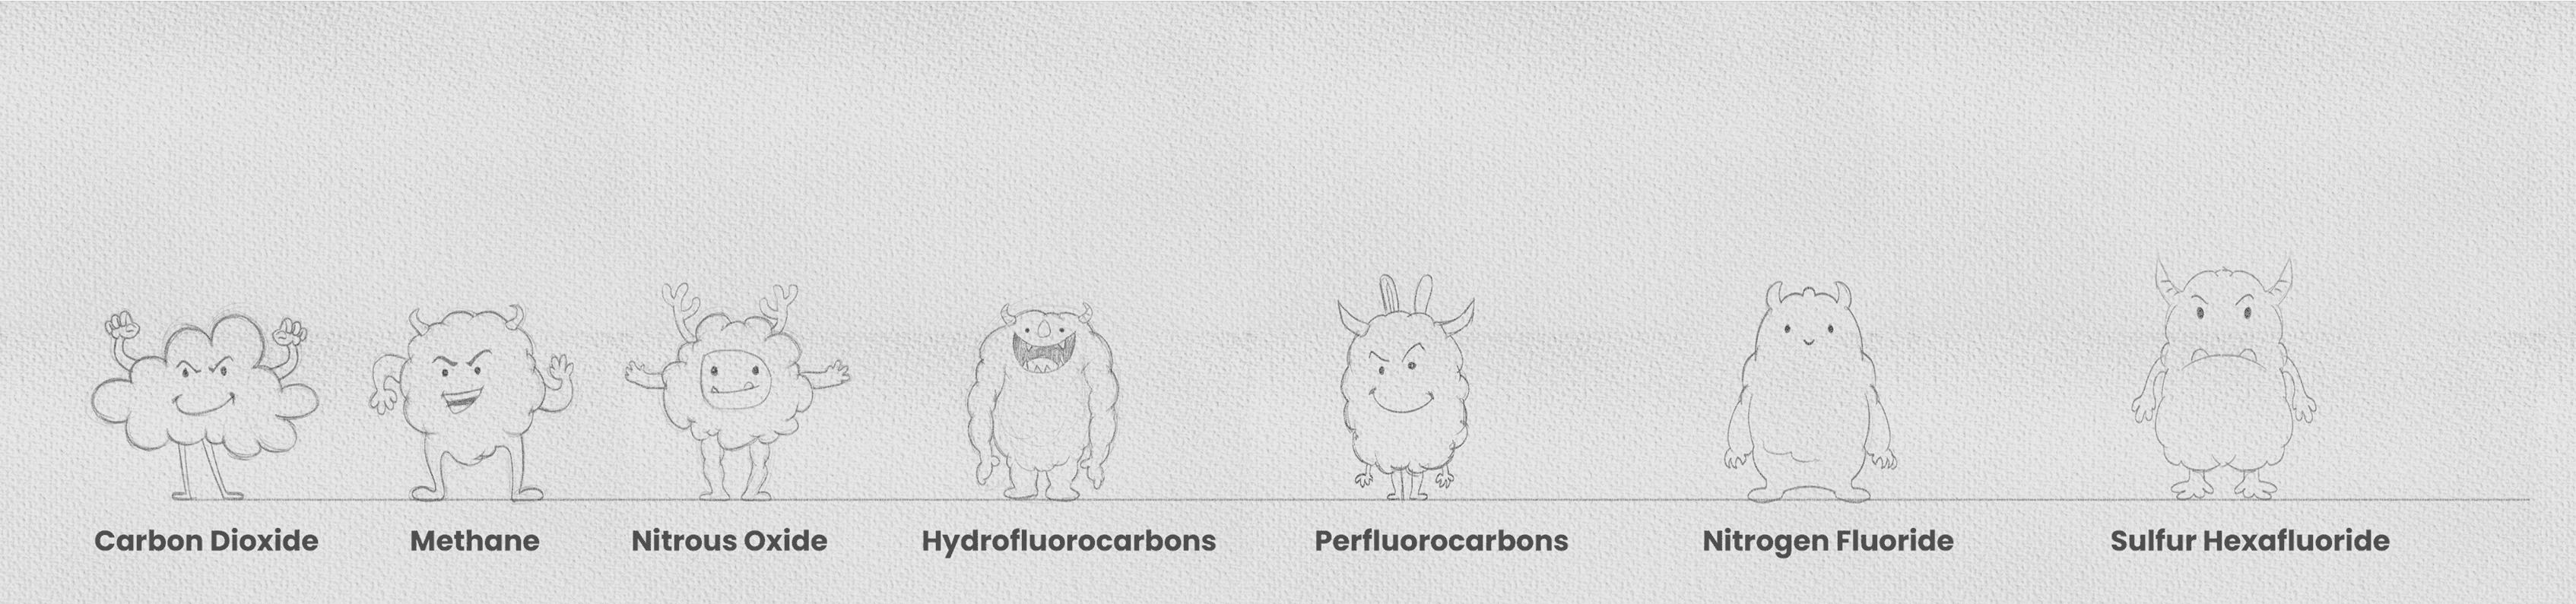
Greenhouse gas characters
To demystify the complex concept of CO2 equivalent (CO2e), we created a family of greenhouse gas characters, each with distinct personalities:
Carbon Dioxide: The familiar purple cloud character, representing the most common greenhouse gas
Methane: An energetic pink character showing its reactive nature
Nitrous Oxide: A calm blue figure illustrating its presence in natural processes
Hydrofluorocarbons: A quirky character representing synthetic gases
Perfluorocarbons: A sharp-looking orange character for industrial compounds
Sulfur Hexafluoride: A larger blue character showing its potent impact
Nitrogen Trifluoride: A complementary character completing the greenhouse gas family
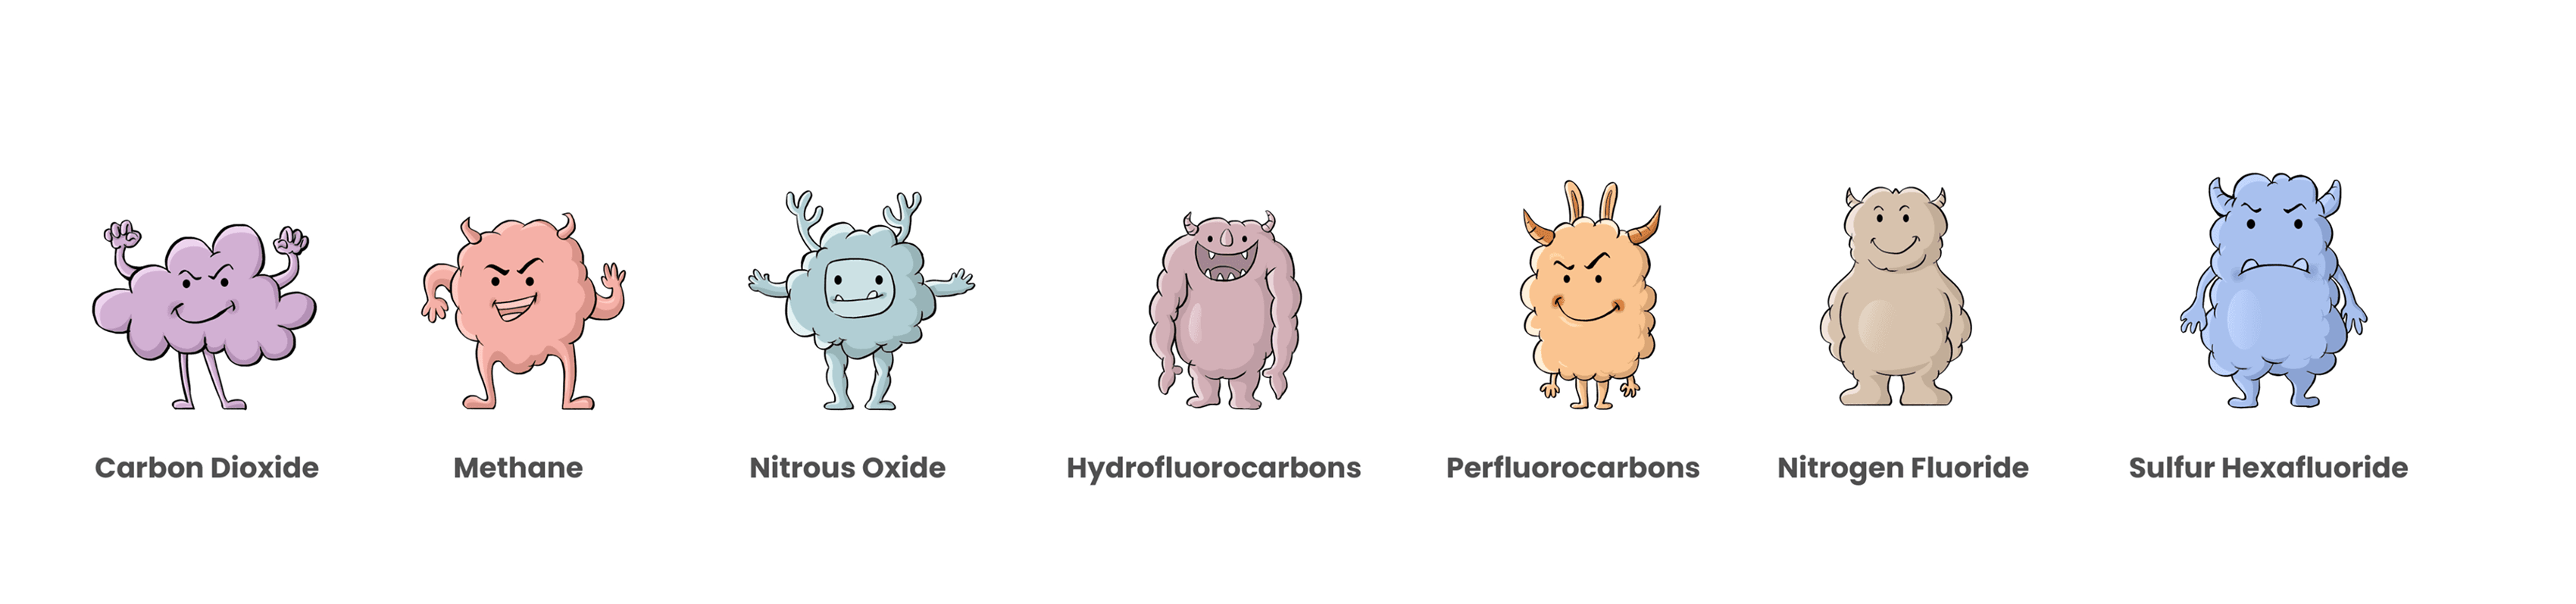
These characters serve multiple purposes:
Break down complex scientific concepts into digestible, memorable entities
Create emotional connections with otherwise abstract chemical compounds
Provide visual anchors for remembering different types of emissions
Add playful elements to serious environmental education
FINAL SHIPPED DESIGNS
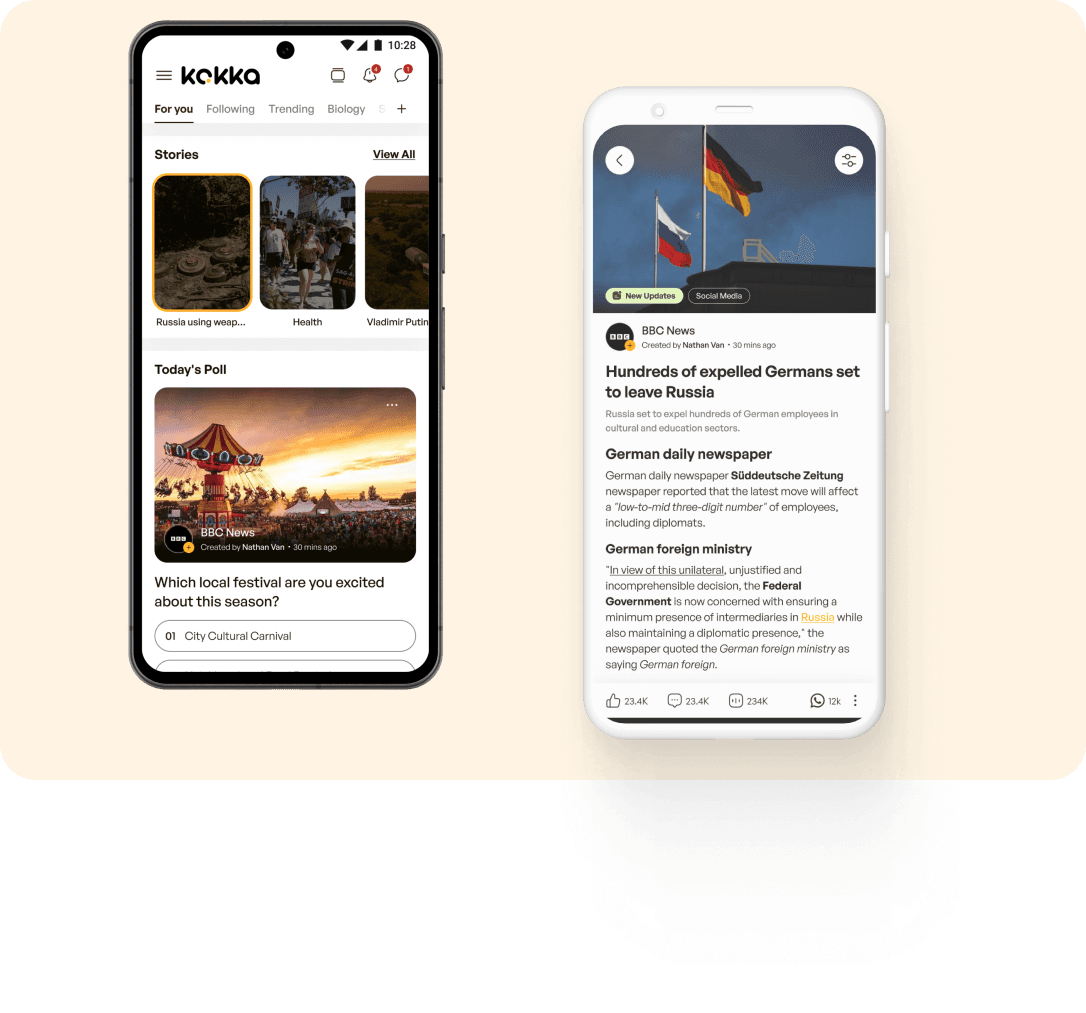
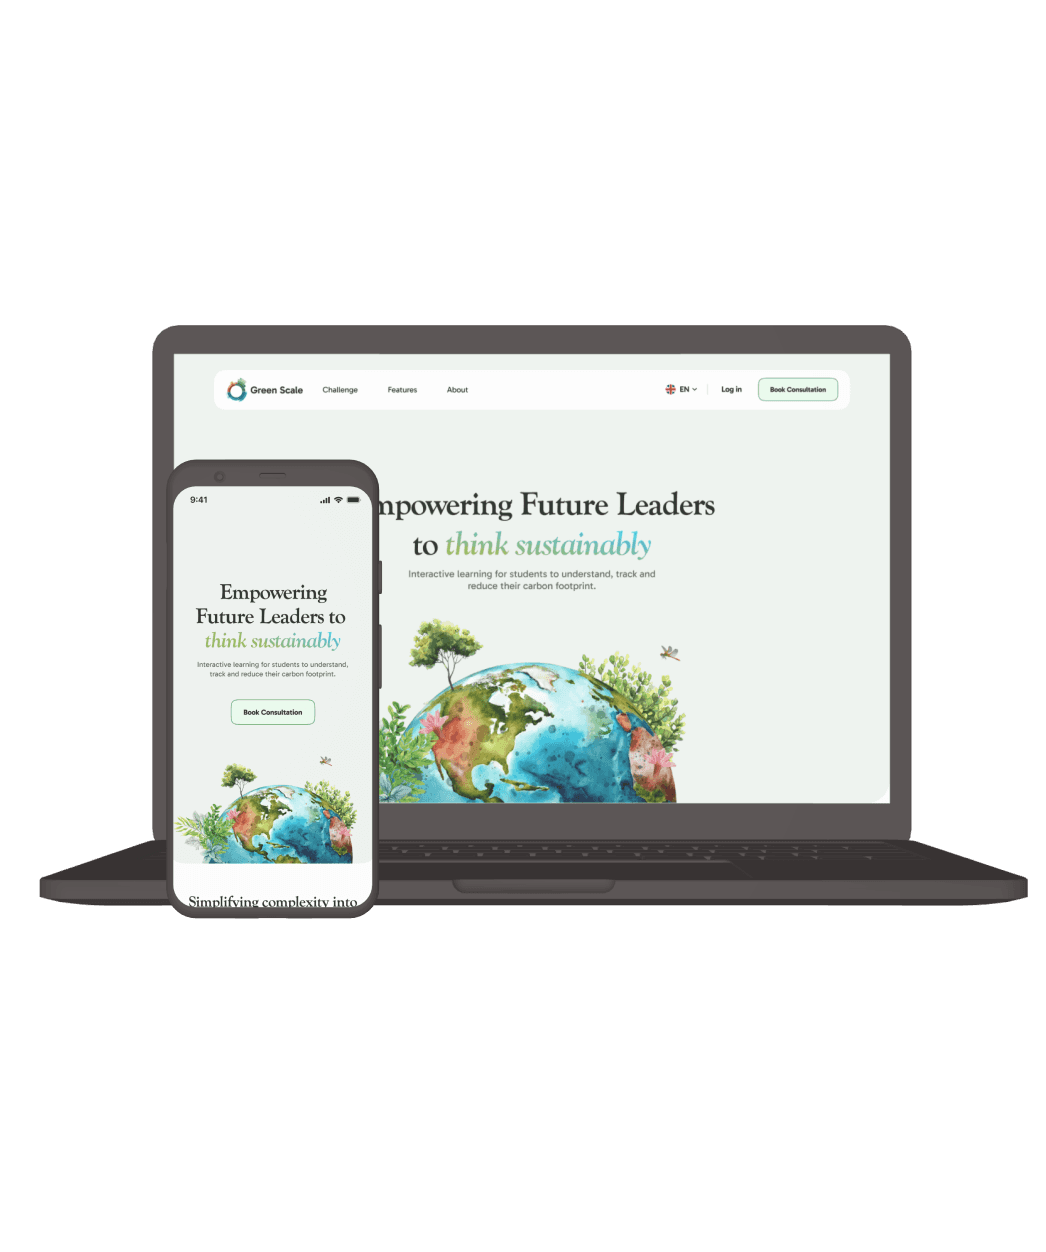
Homepage
The Green Scale homepage is designed as an inviting and informative entry point that sets the tone for users by emphasizing carbon literacy and the power of individual action in combating climate change.
Questionnaire
Instead of overwhelming students with technical terms, we use a conversational, step-by-step approach that asks about daily activities like food choices, travel habits, and shopping preferences. Questions adapt based on previous answers, making it feel more like a chat than a survey. To combat questionnaire fatigue, we've incorporated subtle animations and micro-interactions throughout – like smooth transitions between questions, playful hover states, and progress indicators that respond to user input. These minimal yet engaging design elements keep students interested without distracting from the core task.
Results
Rather than showing just numbers, we translate students' carbon footprint into relatable comparisons they can understand: how many trees it would take to offset their emissions, how their impact compares to students in other countries, how many football fields their CO2 would fill, and how many street lights their emissions could power. This makes abstract numbers feel real and personal.
Literacy
Instead of dense textbook-style information, we've created interactive modules where students can explore how different choices impact their carbon footprint. They can see the impact of their food choices through dynamic visualizations, understand home energy use through an interactive house model, and compare transportation options with real-time calculations.
Reflection
Design process insights:
The importance of prototyping multiple versions of visualizations to find the most intuitive representation
Value of user testing in revealing unexpected pain points in the questionnaire flow
Success of iterative design in refining complex data visualizations into understandable formats
User Behavior Understanding:
Students are more likely to complete lengthy questionnaires when they can see their immediate impact through visual feedback
Environmental education is more effective when personalized to the user's daily activities
Users are more likely to explore educational content when it's presented as an interactive journey rather than static information
Future considerations:
Potential for expanding the platform to include more localized environmental data
Opportunity to develop more gamified elements for younger audiences
Possibility of creating a community feature for schools to compare and share sustainability initiatives